MAYA PROJECT RESEARCH
Description and Results
The following account of our
research activities follows the outline just given. For each
topic, we describe the associated conservation challenges, give
some background knowledge on the topic, describe our research
activities, and give a brief synopsis of our results.
2. Spatial Needs of Neotropical Forest Raptors
Maintaining the full complement of native predators in protected areas or other areas of interest is often difficult, and represents a limiting factor in the effort to maintain thriving, integral biotic communities. Large predators
in particular are typically among the first species to decline or disappear in landscapes affected by human activities; this is due to their low population densities, large space demands, and other factors. Thus conservationists
and land managers often have a special interest in the population densities and spatial needs of predators.
Through the efforts of more than 100 field workers over a 9-year period, we estimated the size of home range used by individuals of several raptor species at Tikal, and we estimated space per territorial pair (the reciprocal
of pair density) for several species.
It is worth emphasizing that these two measures provide somewhat different indications of spatial use. The mean size of home range (the area actually used by an individual) for a species suggests the maximum density of pairs
that might be observed, assuming home ranges fill all suitable habitat. This is sometimes referred to as "ecological density."
|
|
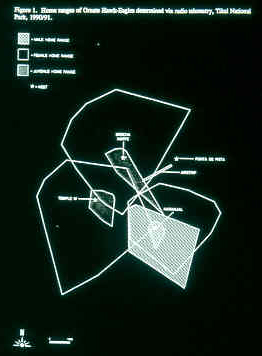
We estimated home ranges
of several Ornate
Hawk-Eagles.
|
The "space per pair" measure we give, which is based on the average spacing between neighboring nests, may or may not correspond closely to the size of home range. Whether it does or not hinges in part on the degree
of habitat patchiness. If habitat suitable to the species is uniformly distributed, then nest spacing is likely to relate closely to mean home range size. This often appeared to be the case in our data. Hence this measure
, too, relates closely to "ecological density." If instead habitat is patchy in nature, then neighboring pairs may be farther apart, and local pair density may
be lower than implied by the average home range size.
For conservation purposes, we are often more concerned with the density observed over larger areas--what might be termed "landscape density." Because of habitat patchiness, as one considers
a larger area, the density of a given species is bound to drop below the local or "ecological" density, simply because some areas are not suitable habitat for the species. Hence, conclusions based on our density
and home range data should be made with caution. Our data tend to portray local or ecological densities, and densities over larger areas are likely often to be lower.
Still, the minimum space required by even a single pair is relevant, as this may help determine the minimum size of forest remnant, or the maximum degree of deforestation and habitat fragmentation tolerable by a viable local
population.
While our analyses of these data are still preliminary, some tentative conclusions can be given here.
Home Range Size as a Function of Male Body Mass
In most raptor species females are significantly larger than males. Thus, in relating spatial use to body size, one must consistently use either male or female body size. We used male body size since males are the main providers
for females and young during nesting, and hence spacing may arguably be expected to relate most closely to male body size.
|
|
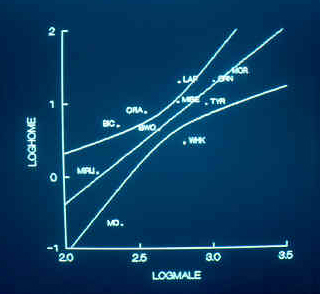
Scatterplot showing the relationship between
male
body
mass (horizontal axis) and size of home range (vertical axis).
|
We estimated home range size for 11 species: nine diurnal raptors and two owls. When the common logarithm (hereafter simply "log") of home range area was regressed
(ordinary
least-squares regression) on log male body mass, body mass explained 56% of the variance in home range size. Home range size scaled as the 1.6 power of male body mass; thus larger species had disproportionately large home ranges when
compared to smaller species. Omitting the two owls, home range area scaled as the 1.15 power of body mass, explaining 69% of the variance in home range size.
At the small end of the body size spectrum, the 170 g Barred Forest-Falcon (Micrastur ruficollis) had a mean home range area of 1.15 km2, and the 240 g Mottled Owl (Strix
virgata) had a mean home range of 0.2 km2. At the large end of the spectrum, one radio-tagged female Crested Eagle (
Morphnus guianensis: 1300 g) had a tentative home range of roughly 25 km2.
Body mass accounted for 56-69% of the variance in home range. Some of the remaining variation is no doubt purely "noise" (random variation and experimental error), while some is probably real and of interest.
There is some indication that food habits help explain home range area, a topic for which our final data analyses are still underway. For its body size, the Laughing Falcon (Herpetotheres
cachinnans), a snake-eating specialist, had a relatively large home range, whereas the partly reptile-eating but much more dietarily generalized White Hawk (Leucopternis
albicollis) had a relatively small home range.
Also, the 900 g Black Hawk-Eagle (Spizaetus tyrannus), which fed on 50% bats and 95% mammals at Tikal, had a home range area estimated at half that of the closely related and slightly larger 1000 g Ornate Hawk-Eagle
(Spizaetus ornatus), with a diet of half mammals and half birds. One study suggests that mammal population densities are typically at least 10 times as high as bird population densities (Brown 1995, p.
133). If this is true at Tikal, this might explain why mammal-eating Black Hawk-Eagles apparently had a smaller average home range area than did Ornate Hawk-Eagles, which fed more on birds. However, this conclusion is speculative.
Space Per Territorial Pair as a Function of Body Mass
In this section we consider space per pair (based on distance between neighboring nests) in relation to body size.
For 15 species (14 diurnal raptors and the Mottled Owl), male body mass explained 60% of the variation in space per pair, i.e., in the density of territorial pairs. This parameter scaled as the 1.43 power of male body mass.
When the Mottled Owl is deleted, the fit is better, explaining 72% of the variance in space per pair, and the slope of the relationship is shallower, scaling as the 1.24 power of male body mass.
Hence home range scaled as the 1.15 to 1.6 power of body mass, and pair density scaled as the 1.24 to 1.43 power of body mass. While the precise slope of these relationships should be regarded as unknown, it seems clear that
both slopes have a body mass exponent somewhat greater than 1.
Schoener (1968) found that predatory birds (including insect predators) had territory and home range size scaling as the 1.21 and 1.39 power of body mass, respectively, quite similar
to our results.
It should be noted that some researchers present the result of such allometric scaling using reduced major axis
regression, rather than ordinary least-squares regression; this results in a different slope for a given data set
(e.g. Peery 2000).
Conclusions, Comparisons, and Implications for Conservation
For the species we studied, the local or ecological density, expressed in terms of the number of territorial pairs per 100 km2 of favorable habitat, ranged from 440 pairs (Mottled Owl) to four
pairs (Crested Eagle). Several species had higher estimated densities at Tikal than those estimated for the same species by a study in French Guiana (Thiollay
1989). However, due to differences in methods and in sampling adequacy, the true extent of local and regional variation in density remains largely unknown.
It is important to note that while these data can suggest the minimum area of habitat that might contain a given number of pairs of a given species, these data cannot replace locale-specific density data. That is, while one
can probably safely estimate the maximum number of pairs that might inhabit a given area, one can never know how many pairs are actually present without simply determining this through field work.
For many Latin American tropical forests, the raptor occurring at the lowest population density is probably the Harpy Eagle--the world's most powerful eagle. While we did not study Harpy Eagles at Tikal, these birds have been
studied by Eduardo
Alvarez-Cordero (1996) in Venezuela and Panama. Eduardo estimated that these eagles occurred at a somewhat lower density than the 4 pairs/100 km2 we estimate here for the Crested Eagle at Tikal.
The above results are based on Whitacre et al.
(2000).
 Literature Cited, Spatial Needs of Neotropical Forest Raptors Literature Cited, Spatial Needs of Neotropical Forest Raptors
NEXT

17
|